
|
Ecobalance of the "Climate Train"
Global warming effect of journey Europe - Japan by train+boat compared to flying
Note: for online calculations of aircraft emissions of greenhouse gases, and the latest web links on this topic, please try the new web page "Flying off to a warmer climate"!
While planning the Climate Train, we sought out figures to compare the greenhouse warming effect of trains and aircraft, but soon found many conflicting figures and opinions which we collected together on our web page to inspire discussion. Dietrich Brockhagen,a physicist who at that time was drafting a report for the European Commission on exactly this topic, decided to make the detailed calculations below for our Climate Train journey, to check that it really was a sensible idea. He then printed 600 leaflets (funded by the Austrian government) containing this analysis to justify to others along the way that our journey was better than flying.
© Copyright note: This section was written by the physicist Dietrich Brockhagen, and should be quoted accordingly.
In the following a comparative CO2 balance of the trip Frankfurt-Kyoto by train and boat and by plane is carried out. The objective is to get the total amount of CO2 equivalent emissions caused by each passenger on this journey.
Train and Ferry: calculation method
The Trans Siberian railway is fully electrified. In Germany the electricity for railways is produced by sources with a slightly different mix from the electricity from the common net. For Russia there is only the common net which provides power for the railways . For the other countries it was assumed, that the railway electricity in these countries was provided by the public net as well. The data is summarised in the figure.
Germany and Poland
In Germany and Poland, German locomotives are used. It was assumed that passengers were using a fast intercity train in Germany and Poland. Data about German trains and passenger transport performance can be obtained from different studies. Typical is a relative minor occupancy level of 45%. The results for energy consumption of German trains were taken for Poland also, only modified by the Polish electricity mix.
Russia and China
Only few data about the Trans-Siberian railway and its performance were available from official documents. However, through contacts with the national railway companies in Russia and China and experts in this field, the following data could be collected in personal communications. They were combined with formulae from the engineering literature to figure out the energy need of the Trans-Siberian railway.
All the journey through Russia and China is electrified (in China there are still a lot of diesel and even steam engines, but not on this route). There are no special power plants for railways, only the usual stations to change the voltage tension.
Data used for calculation of energy used by Trans-Siberian:
Calculation Formulae
Generally the empirical function between drag and speed is: Drag (W/t) = speed (km/h) to the power of two * 0.141. This holds for trains going at a speed of up to 130 km/h. From this you can get the required drag to move the train at a speed of 80 km/h. Multiplying with the weight provides the required power consumption. This has to be calculated for the persons on the train (seats* occupancy level) and the travel time to get the specific translation energy consumption. Add the additional consumption for compressing and cooling in the engine and the heating to get the required end energy consumption. This has to be coupled with the specific Russian electricity mix and the efficiencies of engine, Net and Power plant. Finally the CO2 emissions are obtained using the specific emissions of each seperate energy source: Coal (black): 410 kg CO2/MWh, Oil: 299 kg CO2/MWh, Gas: 210 kg CO2/MWh, Nuclear, Hydro and others: 0.
The author feels that this is not the place to raise a discussion about the problems of nuclear power.
The energy for acceleration after the stops turned out to be three orders of magnitude smaller than the constant consumption and was neglected.
Japan
Since the distance in Japan from Kobe to Kyoto is only 81 kilometres, for simplicity it was assumed that the energy consumption was equal to a German train, only the specific Japanese electricity mix was included.
Ferry from Tianjin to Kobe
Only limited data was available on the fuel consumption of passenger ferries. However, since it was known that the respective ferry is a slow cruising boat, the specific fuel consumption of the ferry was assumed according to rough data, provided in literature.
Results of the calculations for the journey by train and boat
Total travel time is about 11 days.
|
Section of the Journey |
Distance [km] |
Emissions of CO2 per passenger [kg] |
equivalent fuel consumption [litre diesel per 100 Pkm] |
|
Frankfurt - Berlin - Polish border |
649 |
24.0 |
1.17 |
|
Poland (Posen, Warsaw) |
670 |
51.1 |
2.41 |
|
Russian border -Moscow |
990 |
24.8 |
1.15 |
|
Moscow-Chinese Border (Novosibirsk-Irkutsk-Chita) |
6672 |
152.2 |
0.92 |
|
Chinese border-Beijing |
2329 |
88.4 |
1.52 |
|
Beijing-Tianjin |
85 |
4.5 |
2.10 |
|
Ferry Tianjin-Kobe |
2450 |
87.2 |
1.3 |
|
Train Kobe-Kyoto |
81 |
2.19 |
1.08 |
|
SUM |
13926 (great circle 9360) |
438.0 |
1.26 (1.88 related to great circle) |
Source of data
From Frankfurt, London, Paris and Amsterdam to Tokyo there are several different possible routes. About 75% of the flights are not direct flights but have a stop in Moscow, Beijing, Copenhagen or Seoul. However, it was assumed that delegates would take the direct flights and these are done by all airlines (KLM, Air France, British Airways, Japanese Airways, All Nippon Airways) with a Boeing B-747 (only exception: Virgin Atlantic with Airbus A 340). For the B-747 from Frankfurt the following numbers were obtained by a flight simulation program of the German research association for space and air transport.
Accounting for 8% additional fuel consumption due to losses in refineries and transportation this leads finally to 343.43 tons CO2 on a primary energy basis.
Specific energy consumption
From this one can derive the specific energy consumption, considering 368 seats (Lufthansa); with an assumed occupancy level of 80% this leads to 1168 kg CO2 per passenger or 5.02 litres per 100 Passenger kilometres.
Finally, on the 458 km train from Tokyo to Kyoto each Passenger produces another 12.4 kg CO2. All in all, total travel time by plane and train from Frankfurt to Kyoto is 15 hours.
Greenhouse effects of other pollutants from transport
This is not the place to fully discuss the complex area of aircraft emissions on the state of the atmosphere. However, it is important that emissions in flight altitudes 9-13 km are enhancing the greenhouse effect more strongly than the same emission caused from ground based transport since in these heights the atmosphere is cleaner and undisturbed, leading to long residence times of the pollutants (up to half a year or so), whereas emissions caused at surface level are washed out from the atmosphere within a few days. Moreover it is very cold at this height (-40 degrees Celsius) thus increasing the greenhouse potential of the greenhouse gases as well (Planck's law of radiation).
In the following table some greenhouse effects of pollutants from transport are compiled. There has been 10 years of intensive research in this area. However, knowledge is still restricted, so that the following results from research should not be taken as proven but as best estimates.
|
Globally averaged greenhouse effect caused by one unit of fuel use, normalized on the effect of CO2 and integrated over a time horizon of 100 years. |
|||
|
Pollutant |
Train/Boat |
Aircraft |
Knowledge |
|
CO2 |
1 |
1 |
good |
|
Ozone, produced by nitrous oxides |
0.1 |
0.5-2.0 |
medium |
|
Condensation trails |
0 |
0.5-2.0 |
poor |
|
Water Vapour |
0 |
0.5 |
medium |
|
Sulphate Aerosols |
? |
minus 0.5 |
very poor |
|
SUM |
1.1 |
2 to 5 |
very poor |
All sources are from 1995 or earlier. It turns out that water vapour has no greenhouse effect at all when emitted by ground based transport but has a notable effect when emitted by air transport. Similarly, ozone formed by smog during summer in big cities is enhancing the greenhouse effect very little in comparison with CO2, whereas aircraft induced ozone has about the same impact as CO2. This holds for condensation trails as well.
All in all, each unit of fuel used from air transport has a greenhouse effect of about three times bigger than an unit fuel used by ground based transport. This amplification factor is currently assumed by the OECD as well (but based on a different approach).
The satellite picture shows condensation trails induced by air traffic over central Europe. Under certain weather conditions contrails occur and remain for hours in the sky, enhancing the greenhouse effect significantly. Source of picture: DLR, Germany, 1996.
Below: Computer simulation for the impact of air traffic on ozone in flight altitudes of 12km. In mid and high latitudes of the northern hemisphere an ozone increase of about 15% is found. Source DLR, Germany 1997
According to the table above CO2 emissions from the train and boat have to be multiplied by a factor of 1.1 to get the respective CO2-equivalent emissions. For air transport this factor is 2 - 5, here it is cautiously assumed to be 3. Hence, the following figures can be derived from the calculations on CO2 done before. The overall result is summarised in the bar chart.
|
Summary of results |
Train & Boat |
Aircraft |
|
CO2 only emissions per passenger [kg] |
438 |
1180 |
|
All gases: Total CO2-equivalent emissions per passenger [kg] |
481 |
3540 |
|
Fuel consumption per passenger and 100km [litres] |
1.3 |
5.0 |
|
Greenhouse equivalent fuel consumption per 100 passenger-km [l] |
1.4 |
15.0 |
The calculations above were made before our journey. When we actually travelled, we noticed a few extra factors which might be taken into account.
Heating on the train
One memorable feature of Russian and Polish trains was the smell of coal smoke, not from the engine (which was electric), but from the "samovar" at the end of the corridor in each wagon. This provided boiling water for making tea, instant noodles etc., also cold distilled water and hot air to heat the wagon. We do not know how much coal this consumed, it is probably greater than we assumed in the calculation above.
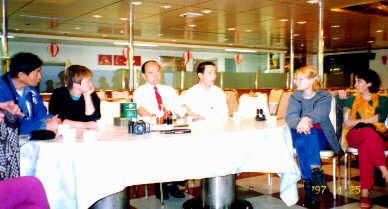
Energy consumption of the boat
One morning after breakfast, on the ferry from Tianjin to Kobe we arranged a meeting with the captain, his steward and engineering officer. He told us that the ship uses about 77 tonnes of fuel per trip, usually has about 90 passengers and 162 tonnes of freight in 90 containers. Most of the income was from freight. Although it is difficult to decide how much energy to assign to carrying passengers and how much to carrying freight, the figure per passenger kilometer is probably higher than assumed in the calculation above. We also asked the captain whether he had noticed any local changes in the climate over the last decades -maybe!
Policy Options to Solve the problem
Technical Improvements
It has been argued by the air travel industry, that technical improvements in fuel efficiency, and aerodynamics of aircraft will go a long way to solving the problem of the contribution to climate change from aircraft emissions. Indeed recently the specific fuel consumption (fuel used per passenger and per 100 km) of aircraft has improved a lot. This trend will continue in the future, but as in the past, will level out with time. Major effects are expected with the introduction of new engine concepts and aerodynamic improvements of the plane and optimisation of the flight performance due to better air space management. In 2015 the specific fuel consumption of planes might be lowered by between 30 and 55% compared with 1990 levels. These translate to worldwide potential fuel savings of 20 to 40% due to the slow penetration of new technology in the global fleet. If this is combined with a modal shift to railways on distances of up to about 700km and the more widespread use of telecommunications, these could potentially be higher but current estimates do not suggest dramatic emissions savings. However in the same period (1990 to 2015) a tripling in the volume of air transport worldwide is expected to occur. This would offset all the possible technological improvements in emissions reductions, and would result in a dramatic increase of overall emissions levels.
In the past environmental policies in the field of air transport have been limited to the regulation of emissions during take off and landing. The related emissions limits were determined by the International Civil Aviation Organisation (ICAO) and subsequently incorporated into national law by the 186 Member states of ICAO. However history reveals that this procedure is not sufficient to protect the environment. In 1991 when ICAO presented the new limits to be introduced by 1996, it appeared that 4 out of 5 engines were already in line with the new limits in 1991. Hence the new limits provided almost no incentive for technical improvement. A new a slightly tighter proposal was blocked within ICAO in 1995. New proposals are not expected till 1999. This demonstrates that with a policy of emission standards closing the gap in the limits is not to be expected soon. All emissions produced during cruising (with climatic impact) are currently not limited at all.
A common approach is to solve environmental problems using ‘market forces’. The European Union has dedicated itself, in theory at least, to the ‘polluter pays’ principle which means that the ‘costs’ of damaging the environment should be paid by the polluter. Therefore charges should be imposed on the different pollutants according to how damaging their effects are. Hence, prices would reflect on the user through the environmental impact of his/her transport behavior. So far, airlines only pay more or less the costs of the air transport infrastructure such as airports or flight management systems. Obviously charges should be introduced on a global level, but it is not realistic to expect such charges to be supported by ICAO, which limits itself to promoting the increased use of global air transport. However recent studies indicate that even a worldwide charge of 300% on fuel prices would not be sufficient to stop the current fast increase of air traffic emissions.
A Kerosene Tax
(Note the remainder of this section was written by Ben Matthews)
The introduction of a tax on Kerosene has been proposed by the European Transport Commissioner Mr Neil Kinnock so that companies would be encouraged to burn less fuel overall. However not only do the current rules of the International Civil Aviation Organisation forbid any tax on kerosene for international flights, but also unless all countries within a region agreed to impose the same tax, aircraft would simply fill up wherever the tax was lowest. The notion of an international tax imposed by a UN body is strongly opposed by many countries on the grounds of national sovereignty.
The other principal problem with the tax approach is the need to predict in advance the level of the tax which will achieve a given reduction in emissions - this prediction is very difficult, yet repeatedly adjusting the level of a tax to get it right would be politically unpopular.
Quotas
A possible alternative to imposing a tax is to incorporate aircraft emissions directly into the tradable emissions quota system which is expected to be set up at COP4. The intrinsic advantage of quotas rather than taxes is that the total emissions reductions are set in advance by the total quotas allocated, so there is no need for economic prediction to achieve a particular level of CO2 in the atmosphere as market trading will adjust the price automatically.
However to include aircraft and shipping emissions within countries’ national quotas raises objections from some small countries, for example, who do not wish to be penalised for traffic in "transit" through their ports. The Global Commons Institute’s protocol proposals (see GCI’s web site) tentatively suggested that it might be better to require international aircraft and shipping companies to purchase their own quotas from governments. Such companies would start with zero quota but be allowed to purchase it from any country whose emissions are limited by the Kyoto protocol or subsequent agreements. Since the quotas allocated to countries will be tradable (under rules to be agreed at COP4 in Buenos Aires) the price should be almost the same anywhere. The prospect of being allowed to sell surplus quota should also encourage developing countries to accept a limit (not necessarily a reduction) on their own emissions -currently they have not agreed any limit. This would only work if it is assumed that in the future there will be a gradual convergence towards an equitable distribution of emissions quotas between countries -e.g. on a per capita basis (see ‘Contraction and Convergence’ graphic in previous chapter).
To avoid financial speculation companies should be allowed only to buy emissions quotas for their own use, never to sell them, and such quotas would have to be used within a short timescale (e.g. 2 years) to prevent this becoming another "futures market".
This is an idea for the future and will take some time to negotiate.
|